Beginner’s guide to Technical Analysis & Crypto Charts

I want to become a better trader.
Gigabrain trader @CryptoCred has a great YouTube series on technical analysis, where he breaks everything down from 0.
I’m watching it from scratch & taking detailed notes. I just finished part 1: Intro to Technical Analysis & Candlesticks.
Here is a complete breakdown & introduction to Technical analysis (TA) & candlestick charts.
Let’s dive into it & learn together.
What is Technical Analysis (TA)
Technical analysis is just a tool to make calculated guesses on the future price based on the price history. It’s all about probability. It’s all about working to get the odds in our favor.
Risk defined entries & exits.
TA helps us identify defined exits & entries based on risk & price history. E.g. Imagine you want to hold a coin for a long time.
TA is a tool to help you estimate the best risk to reward position.
I dive deeper into risk & reward here:

TA is not a way to know the future price.
It’s a game of bets & making calculated based rooted in price history. You won’t be able to know the future price of a coin with TA.
Technical analysis is best thought of as a risk management tool.
With that, Let’s dive into candlesticks.
Candlestick Anatomy
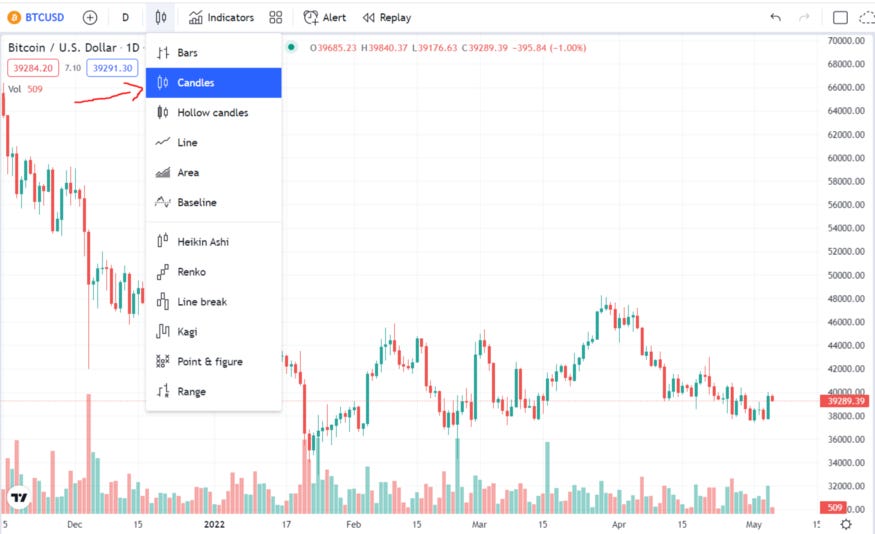
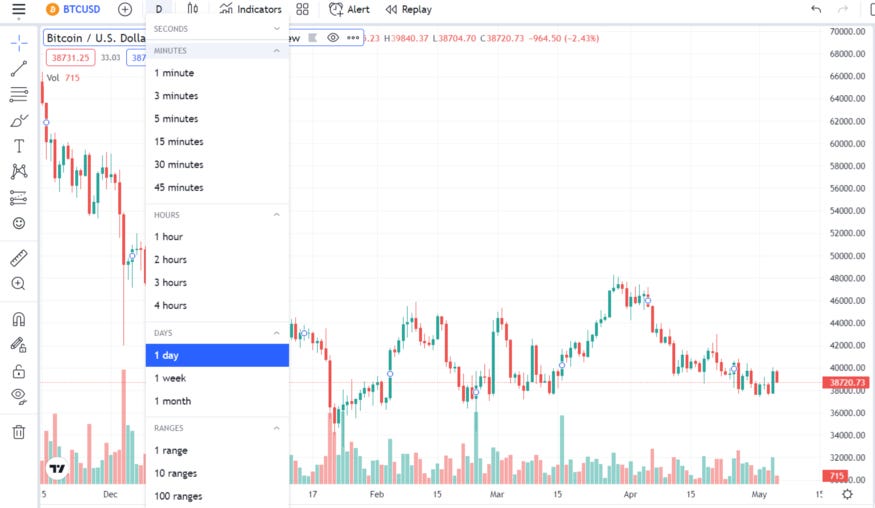
Candlesticks are one version of a price chart. Go on TradingView. It’s a platform that shows you charts on just about everything & have tons of tools for TA. There are different types of price charts.
We’re going to be clicking on candles.
Candlesticks are a way to track change in price over particular time frame. Each candlestick represents price change over that time period.
Candlesticks can be broken down into 3 parts:
Candle Color
Candle Body
Candle Wicks
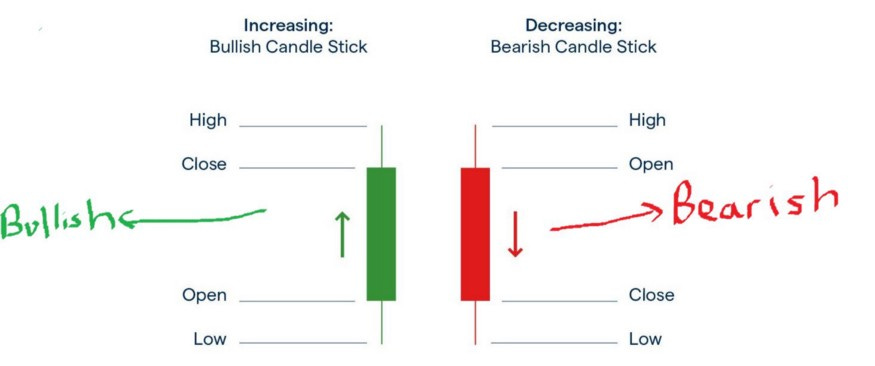
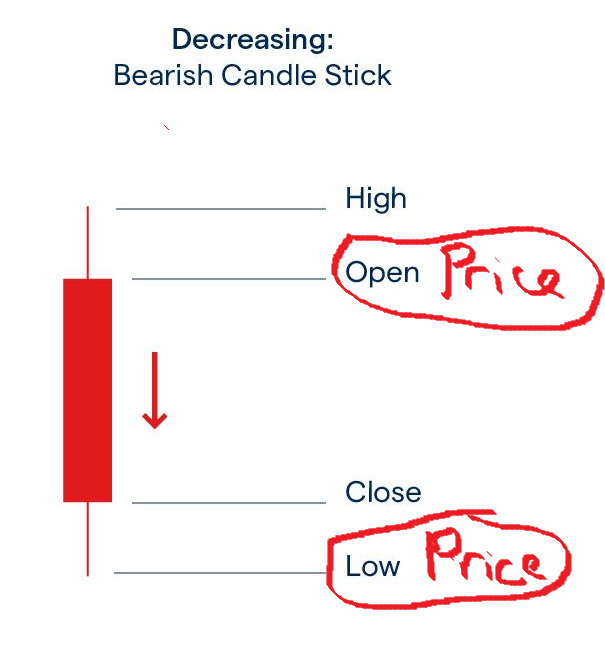
Red Candles
Candle Color Red candle = bearish. The closing price was LOWER than the opening price within a particular time frame.
E.g. you’re tracking the price of btc over a day.
The candlestick started at btc = $50.
24 hours later, the price is $40. The candle is red
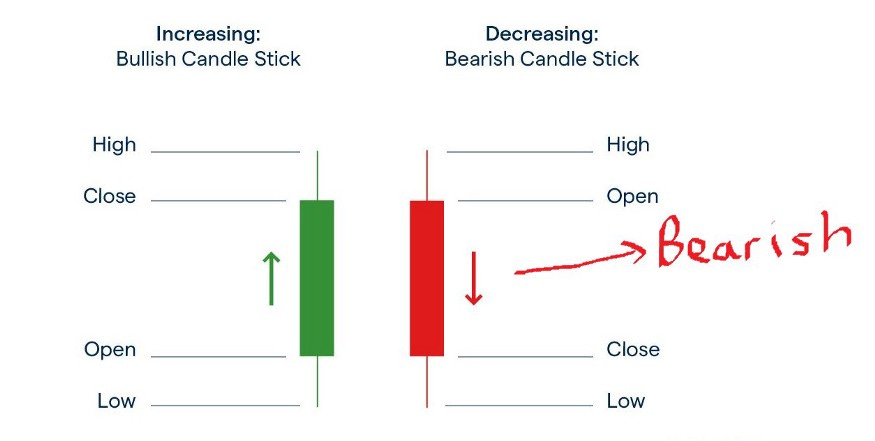
Green Candles
Green candle = bullish The closing price was HIGHER than the opening price within a particular time period.
Same example as before, you’re tracking btc’s price over a day. Opens at $50. Closes at $55. The candlestick is green.
Timeframes
Each candle represents the change in price over a particular timeframe.
There are plenty of timeframes to choose from: 5 min, 1 hour, 1 day, 1 week, etc. If you choose 1 day. Each candle will represent the change in price over a day.
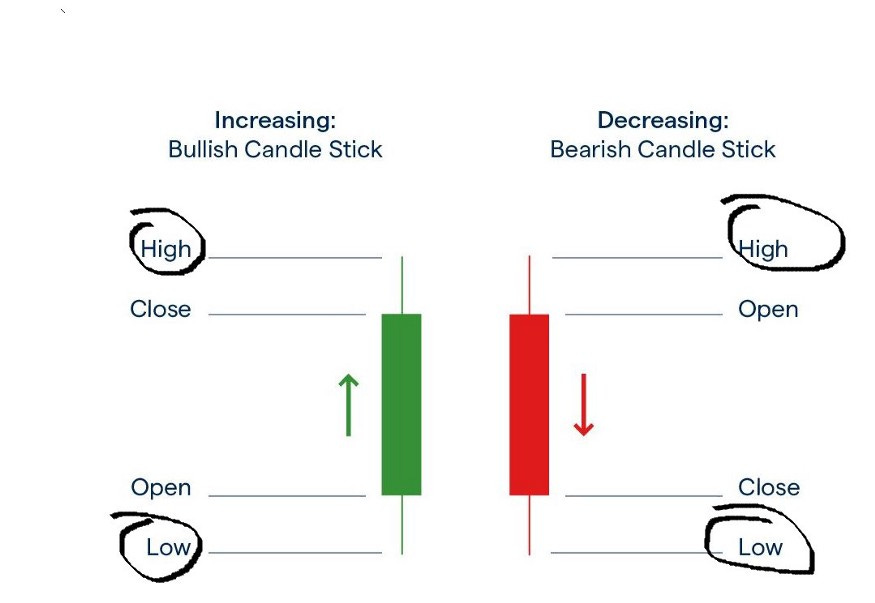
Candle Body
For red candles,
The upper body is the opening price.
The lower body is the closing price.
This is because the red candle is supposed to represent a drop in price.
For Green Candles,
The lower body is the opening price.
The upper body is the closing price.
This is because the green candle is supposed to represent an increase in price.
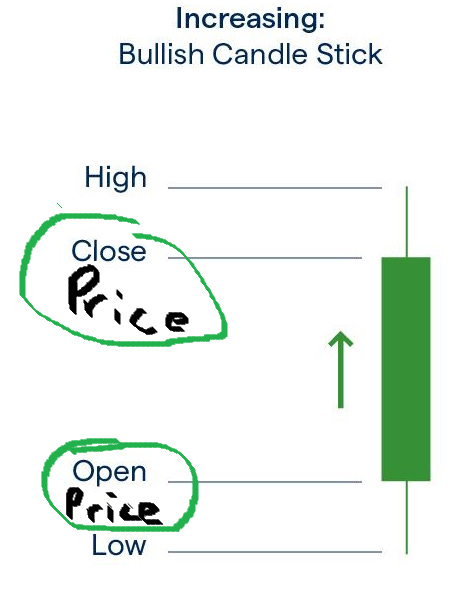
Candle wicks
Upper wick: Highest price point reached within that particular timeframe
Lower wick: lowest price point reached within that particular timeframe.
An example will clear up any confusion.
Let’s say we’re watching the price of BTC over a day.
So the candle represents the change in price over that day.
Day 1, BTC is $50. 24 hours later. It’s at $45. So it’s a red candle.
Opening/Closing price ≠ Highest & lowest price.
During this entire day, the price may have gone higher than 50 and/or lower than 40. The wicks represent the highest & lowest points during that time frame. The bodies represent where they started & ended.
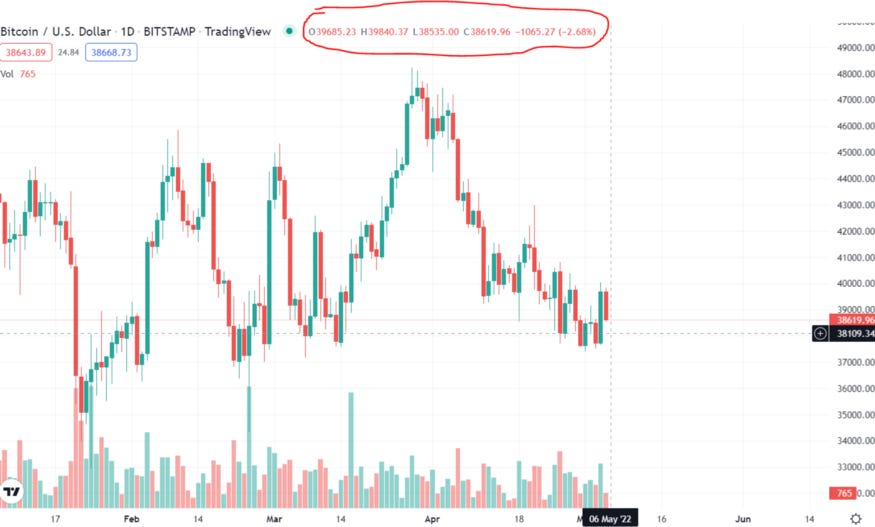
Candlestick OHLC
When your cursor is over a particular candlestick, it should show you:
Open (opening price)
Close (closing price)
High ( Upper wick)
Low (lower wick)
OHLC for short. Tradingview shows you this right up top.
You can use tradingview to mark key numbers like lows & highs.
Let’s say you want to identify yesterday’s high.
Click on Magnet mode & hover your cursor over yesterday’s high. It’ll draw a line for you showcasing yesterday’s high.
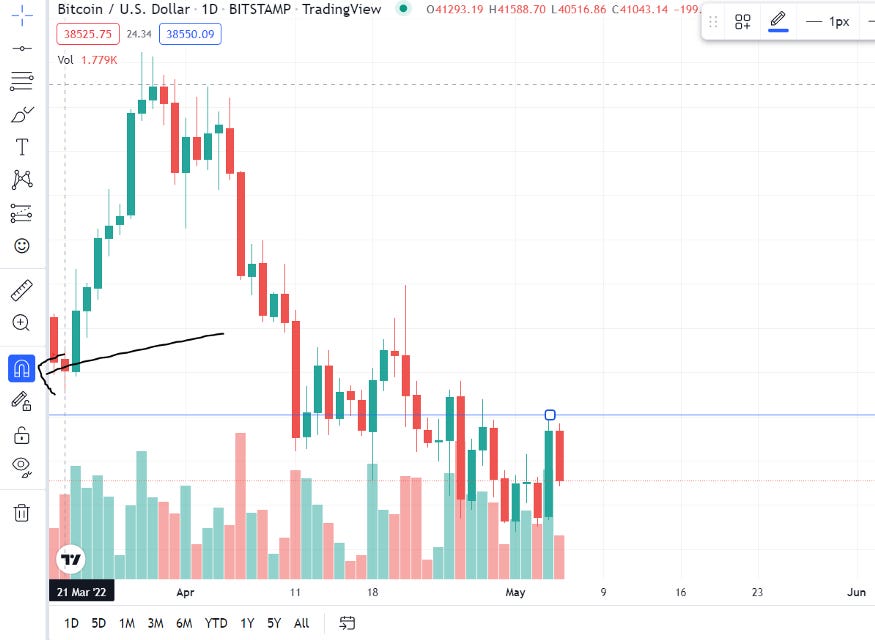
This can be used to set key trend lines. It has many uses & is a useful way to keep track of key metrics.
For example, This allows you to change the time frame to, say, a candle every hour & still keep track of the high of day.
Diving deeper into Time frames
The time frame you choose dictates the time period that 1 candle represents. In a 1 day chart, each candle represents 1 day.
Higher time frame candles are made up of lower time frame candles. A 1 day candle is made up of 24 1 hour candles.
Candle Closes are very important. A lot can change between open & close, especially for higher time frame candles. Making decisions before the close can lead to baseless, incorrect signals. It’s usually a good idea to wait until the candle closes before getting in.
Beginners should focus on higher timeframes. Pick 1–2 timeframes (one higher, one lower) & spend some time monitoring them. Cred’s fav are Daily & Hourly
Candlestick patterns
Price movements sometimes form patterns. Traders use these to make guesstimates on price movements.
They’re a very popular tool used by traders. Here’s an article that goes deeper into what they are.
Candlestick patterns are a big vice for beginners.
Simply learning patterns won’t tell you anything. You need context. There are a lot of different types of patterns. Some of
Cred‘s favs:
Swing High/Low
Doji
Shooting Star/Hammer
Engulfing
Tweezers
These are just names of different patterns. Here’s a list of the different kinds of patterns.
Merely learning these patterns won’t do you anything. You shouldn’t just memorize these patterns & trade off of them. It’s not that predictable.
Here’s how to make good use of patterns:
Look for higher time frame clear patterns, where it makes sense
Use them when there’s a reversal pattern with a strong up or down trend.
Don’t blindly trust patterns. There’s no easy route.
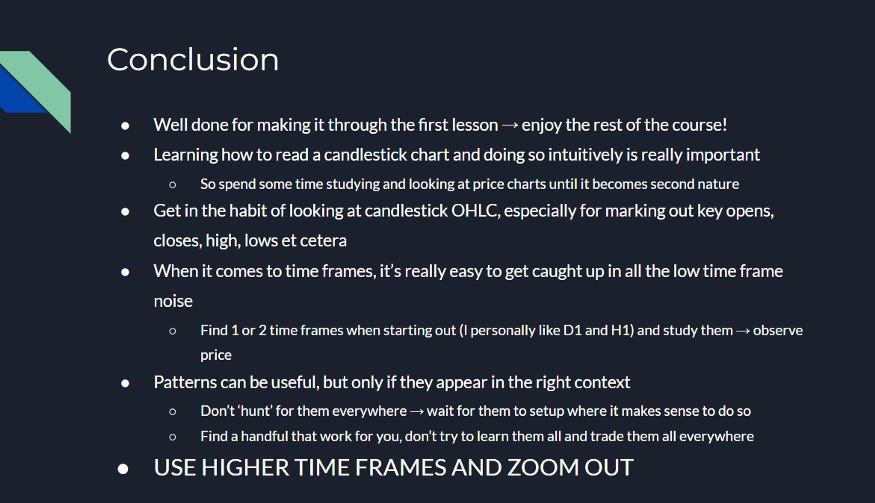
Wrapping up
Here are 2 important tips:
Focus on higher timeframes. Hourly & Daily candlesticks are some good starting points
Zoom out.
And that’s it. Here’s the summary
I HIGHLY recommend you go watch @CryptoCred’s video explanation of this. He does a great job of explaining this, he has a ton of insights.
Huge shoutout to him for taking the time for making this series & sharing his tips.
I hope this was insightful. More coming soon, follow my substack to keep up.
Also, Follow my twitter @Cov_duk for daily insights & alpha.